| HII explorer, a tool for detecting HII regions in IFS datacubes. | |||
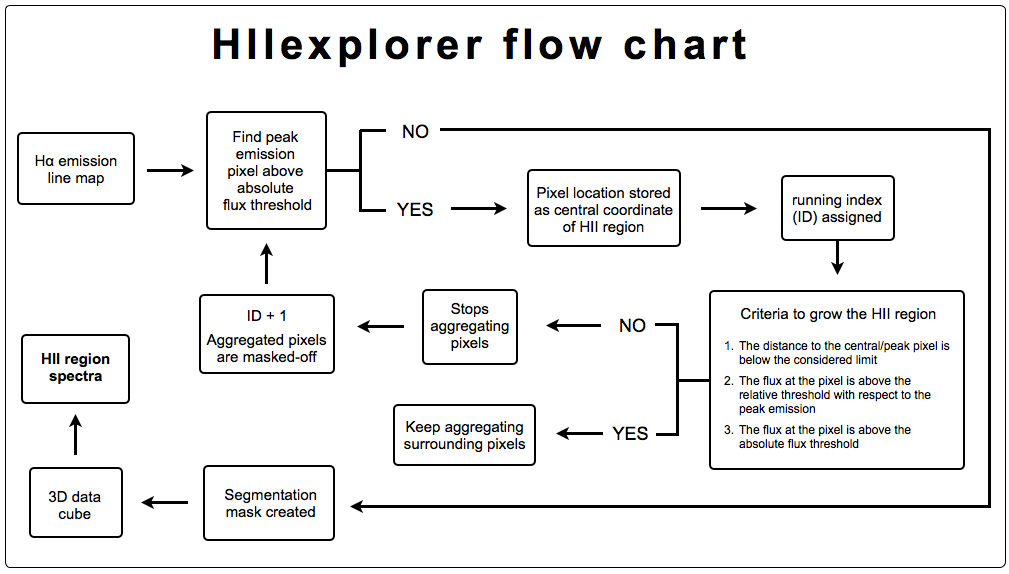
Basic description HIIexplorer is a package for detecting and extracting the integrated spectra of HII regions from IFS datacubes. The procedure is based on some basic assumptions: (a) H ii regions are peaky/isolated structures with a strong ionized gas emission, clearly above the continuum emission and the average ionized gas emission across the galaxy; (b) H ii regions have a typical physical size of about a hundred or a few hundreds of parsecs (e.g. Gonzalez Delgado & Perez 1997; Lopez et al. 2011; Oey et al. 2003), which corresponds to a typical projected size at the distance of the galaxies of a few arcsec for galaxies at z~0.016 (the ones used in the studies of our interest). The algorithm requires a set of input parameters: (i) a line emission map, with the same world-coordinate system (WCS) and resolution as the input datacube (preferentially an H-alpha emission line map); (ii) a flux intensity threshold for the peak emis- sion of each H ii region; (iii) a maximum distance to the peak location for a pixel associated with each H ii region; (iv) a relative threshold with respect to this peak emission of the minimum intensity of each H ii region; (v) an absolute threshold of the minimum intensity corresponding to each H ii region. All these parameters can be derived from either a visual inspection and/or a statistical analysis of the Hα emission line map. The algorithm produces as an output a segmentation FITS file describing the pixels associated to each H ii region, designated with a running index starting with 1 (e.g. the primary H ii region ID in this article), with the zero reserved to areas not associated with any H ii region (i.e. regions free of emission or below the absolute threshold described above). The segregation algorithm is based on a simple iterative pro- cedure, summarized in the flow chart shown in Fig. 1. As a first step the algorithm looks for the brightest pixel within the emis- sion line map. Its location is stored as the peak/central coordinate of a new H ii region, associated with a certain running index (ID number). After this, the adjacent pixels are aggregated to this H ii region if all of the following criteria are fulfilled: (i) the dis- tance to the central/peak pixel is below the selected limit; (ii) the flux at the pixel is above the relative threshold with respect to the peak emission; (iii) the flux at the pixel is above the absolute flux threshold described before. Whenever any of these criteria are not fulfilled the aggregation procedure stops, the ID number is increased by one, all the aggregated pixels are masked-off, and the peak-identification procedure is repeated. The overall proce- dure stops whenever no new peak is detected above the selected peak-intensity threshold.
Download, Requirements and Installation (Perl Version) The last stable Perl version of HIIexplorer can be download here. HIIexplorer Perl version requires the following perl modules to be installed in your computer:
Statistics::OLS
All this modules can be found at CPAN.
It is recomended the lastest possible version of PDL.
You need to define an environmental variable, HIIEXPLORER_PATH with
the directory of your installation. E.g.,
If you do not get any error or warning message you have suscessfully installed
HII_explorer. Then, add the directory DIR to your PATH. If you find any problem,
please send an email to S.F.Sanchez How to use it?
The basic commands to use HIIexplorer are the following ones:
This script creates a narrow-band image of H-alpha extracted from the datacube.
A different initial map can be used.
This script created the segmentation map of the HII regions (with 0 being the diffuse emission area). It requires
as input: (i) The emission line map product of the previous step, (ii) The minimum peak intensity for a considered
HII region; (iii) The maximum distance between a peak and a spaxels belonging to the considered region; (iv) the minimum fraction
of flux relative to the peak for a spaxel to be aggregated to the considered
region and finally (v) the minimum therehold, below which there will be no
coadded spaxels. The output of this procedure is the segmentation map and a
mask excluding those pixels below the thresshold.
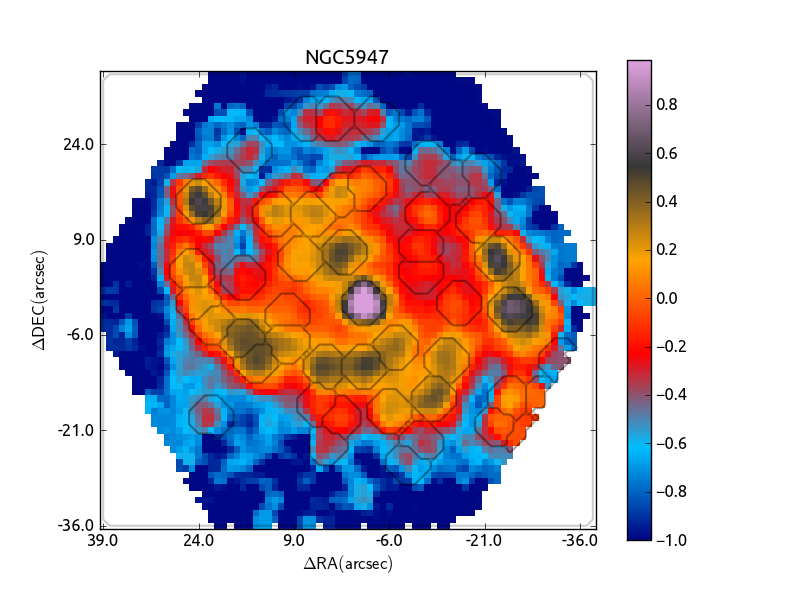
The result of this process can be seeing in the Figure at the top of this webpage.
This script extract a RSS with each spectrum corresponding to a single HII region from the input datacube, using the segmentation
information provided by the previous script.
Similar procedure as the previous one, but in this case it is extracted the aperture spectra corresponding to the second extension
of the considered datacube, that in CALIFA corresponds to the error map. | |||