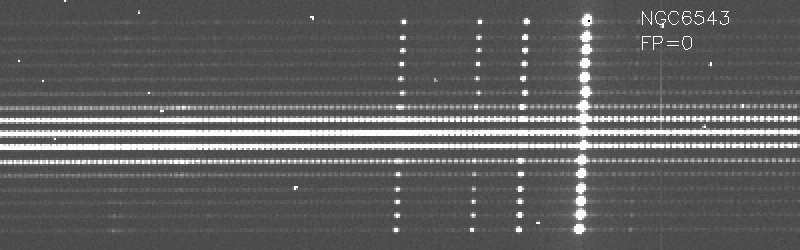
Fig. 15 : PYTHEAS scan with PMAS
Scan now through a series of science exposures of the planetary
nebula NGC6543, observed during a commissioning night on August 30, 2004.
The fraction of the CCD frame depicted above shows a group of 16 fiber
spectra (= one row of IFU lenses) in the wavelength region
near 500nm, with the strong lines of H_beta, He I 4922,
[O III] 4959, and [O III] 5007
(from left to right) in the right half of the frame.
Observe how the PN emission lines are becoming
bright or dim, depending on the coincidence of a matching Fabry Perot
order central wavelength with the wavelength of the emission line.
During the scan, several faint lines are brightening up from the sky background
continuum as they are falling into the transmission band of a passing
Fabry Perot order. The 3-5 bright rows in the middle belong to the
central star of the nebula, which exhibits a continuum spectrum.
. . .
NEXT FRAME
Last update September 12, 2004 by M.
Roth