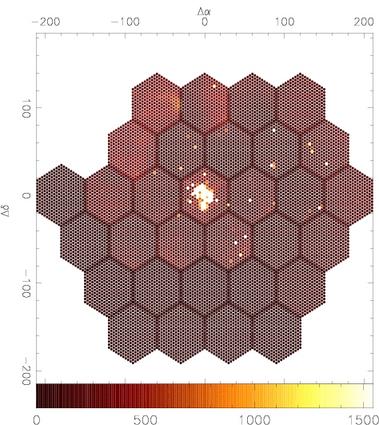
Fig 1:The 31 individual Mosaic Pointings of PPAK, comprising each one 331 individual spectra.
Introduction.
The Orion nebulae was discovered in 1610 by Nicholas-Claude Fabri de Peiresc. Located at a distance of about 1,600 (or perhaps 1,500) light years, the Orion Nebula is the brightest diffuse nebula in the sky, visible to the naked eye, and rewarding in telescopes of every size, from the smallest glasses to the greatest Earth-bound observatories and the Hubble Space Telescope. It is the main part of a much larger cloud of gas and dust which extends over 10 degrees well over half the constellation Orion. The linear extend of this giant cloud is well several hundreds of light years. It can be visualized by long exposure photos (see e.g. Burnham) and contains, besides the Orion nebula near its center, the following objects, often famous on their own: Barnard's Loop, the Horsehead Nebula region (also containing NGC 2024 = Orion B), and the reflection nebulae around M78. Already impressive in deep visible light photographs, the Orion Cloud is particularly gorgeous in the infrared light.
The Orion Nebula itself is still a big object in the sky, extending some 66x60 arc minutes, thus covering more than four times the area of the full Moon. Due to that it has been targeted for centuries by many different instruments at different wavelength ranges and width different techniques (e.g.,ADS), in order to understand the nature of its ionization and the stellar population. In particular several narrow-band programs have studied the 2 dimensional distribution of the ionized gas, looking for bow-shocks, jets and outflows from young stars (e.g.,Fig.1). Many spectroscopic surveys have studied the ionization conditions at different areas, an in particular, in the central area (the Trapezium) and the high-ionization area in south-east. However, due to its large area, no complete spectroscopic survey has been done over such big area.
We present here an Integral Field Spectroscopy Survey of the central 5' x 6' area of the ORION nebulae.
Observation and Data Reduction
Observations were carried out the night of the 21st of November 2004, using the PMAS spectrograph (Roth et al. 2001) in the PPAK mode (Kelz et al. 2006), at the 3.5m telescope at the Calar Alto Observatory. PPAK is a wide-field Integral Field Unit, consisting of 331 science fibers packed in an hexagonal bundle of 72" x 64" field-of-view, with a filling factor of ~65%. In order to test the capabilities of the instrument for Mosaicing, and covering of large areas, we dedicated a low-transparency/bad seeing night to obtain low-resolution spectroscopy of the largest possible area of the ORION nebulae. The nights were allocated to Dr.M.Verheijen, who was directly involved in the development of PPAK, and very well willing to perform this test in an otherwise useless night.
We obtained 31 mosaic pointings of 2s exposure time on the central regions of the ORION nebulae with PPAK using the V300 grating (range ~3700-7100Å, FWHM~1.6 Å), and covering a total area of ~5' x 6' (~30 arcmin2). To our knowledge this is the largest area ever covered with an IFU in a contiguous way. The data, comprising ~10000 individual spectra, are in the process of being reduced using R3D (a package for reducing IFS data also developed at Calar Alto), and they will be freely distributed for the community, once the reduction and calibration processes has been finished (as a "legacy" of the PPAK project).
Figure 1 illustrates the observing strategy of the Mosaic, starting from the
very center of the Nebulae, and following and spiral pattern. Each individual
pointing overlaps in one of the edge of the PPAK bundle hexagon with the next
one, to ensure enough overlapping for creating the Mosaic.
Comparison with Narrow Band Images
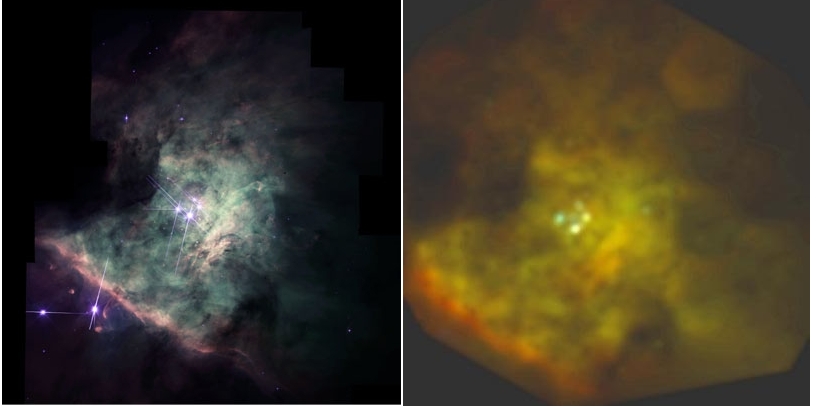
Fig 2:The left panel shows a three color image created using HST/WFPC
Hα, [OIII]5007, and UV images (credits: Jeremy Walsh), while the right
panel shows a three color image reconstructed from our PPAK Mosaic,
extracting the integrated flux in the wavelength regions of Hα,
[OIII]5007 and Hβ. Despite of the large different in sampling and
resolution, it is clearly seen that most of the substructured of the ionized
gas are clearly reconstructed by the PPAK data.
The Data
Figure 3 shows a few examples of the spectra in the dataset. The top-left
panel shows the spectrum (still not flux calibrated) of one of the trapezium
stars. The top-right panel shows a single spectrum extracted from the
central regions, near the trapezium, showing the gaseous emission. The
Balmer emission line series, from Hα to Hγ, and another high- and
low-inization lines, like [OII]3727,37, [OIII]4959,5007 and [SII]6717,31 are
clearly identified. The top-left panel shows a similar spectrum of the
high-excitation region at the south-east (see Fig. 1). Finally, a detail of
the [SII]6717,31 spectral region from a single spectrum taken in the fainter
regions is shown in the bottom-right panel. This last panel illustrate the
signal-to-noise of the spectra, even in the faintest regions.