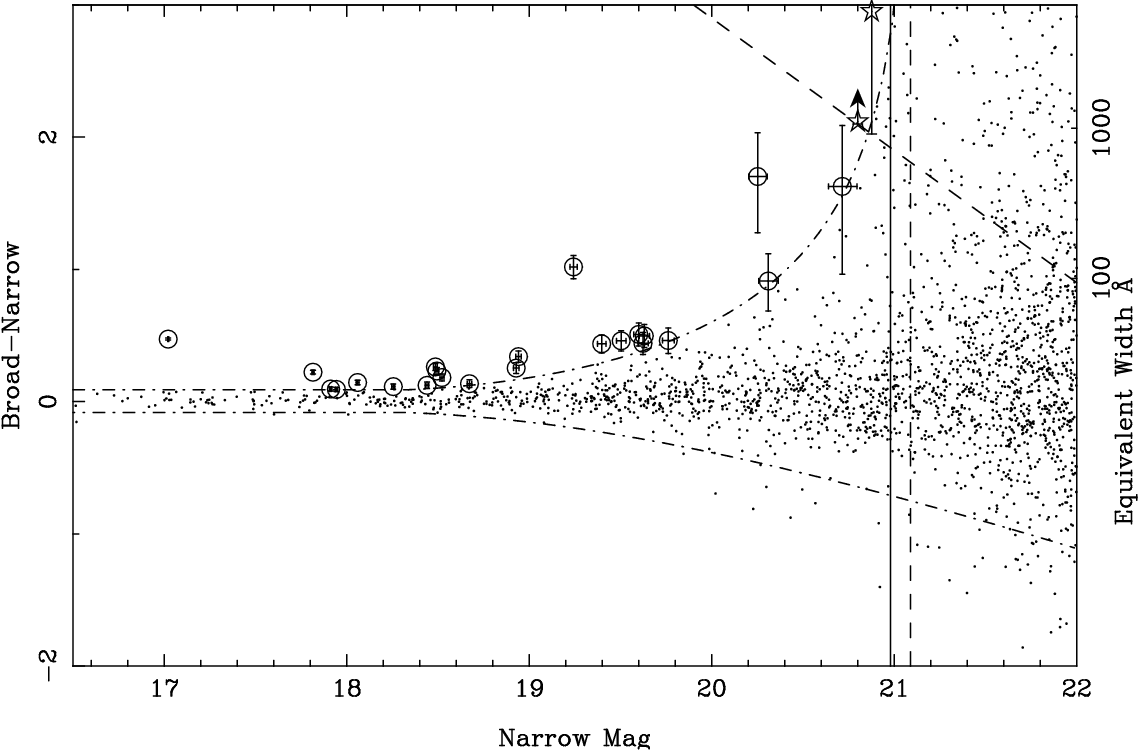
Figure 1: Color magnitude selection diagram. The objects selected are 3-σ over the mean color. The candidates are a mixture of galaxies and stars that need further analysis
We present a long-term project to study the characteristics and evolution of current star-forming galaxies at z∼0.24. The selection of the samples is carried out by detecting Hα emission-line objects in deep images taken with narrow-band filter tuned to 8200 Å. Here we present photometric redshifts, emission-line luminosities and multi-band photometry. The physical properties of these galaxies appear to be remarkably similar to those of local galaxies selected in the same way. The results support the idea that the higher Star Formation Density measured at redshift z∼0.24 is due to the increase of the density of bursting galaxies and not to an intrinsic change on overall galaxy properties.
Galaxy evolution during the last half of the life of the Universe is now well established. The period since z∼1 until the current epoch has been characterized by clear changes in the overall properties of the Universe, such as Star Formation Rate (hereafter SFR) density (Madau et al. 1998). Simultaneously, the galaxy population of the Universe since z∼1 has experienced substantial changes.
The extended UCM survey is a natural extension of the Universidad Complutense de Madrid survey of local star-forming galaxies, being all this work mainly based on data taken with different telescopes at Calar Alto Observatory. Our goal is to build homogeneous samples of current star-forming galaxies covering the redshift range up to z∼1.
Here we show the work done and currently in process with the sample at z∼0.24.
We have carried out two observing campaigns at CAHA with CAFOS, at 2.2m telescope. We have used the filter 816/16 (its characteristics can be found in the filter list of CAHA). In conjunction with a broad-band I filter, it was used to explore some region inside the ELAIS-N1 field.
We were awarded with two observation campaigns. The first campaign was in June 2000, four nights. Two of them were lost due to dust in the atmosphere. In the other two nights the conditions were no photometric. The second campaign was in August 2001, a total of 4 nights. One night and a half were lost. Photometric conditions were not required, and the data taken was usable. The mean exposure time was 500s in broad band and 4000s in the narrow-band filter.
The candidates to be star forming galaxies are selected by their color excess in mB-mN, where B stands for broad filter and N for narrow filter.
Figure 1: Color magnitude selection diagram. The objects selected are 3-σ over the mean color. The candidates are a mixture of galaxies and stars that need further analysis
The selection of the candidates is made 3-σ over the mean color (Figure 1). A few candidates are not detected in the broad band. For these marginal detection, the 5-σ limit magnitude in the broad band is used in substitution and the flux lines and equivalent widths of the lines are only lower limits.
The candidates are a mixture of galaxies with emission lines and stars. For the set of filters used, we expect the stars to be of first (hot) types. To separate the stars from the sample of candidates, we use the STELLARITY parameter of SExtractor (Bertin & Arnouts 1996).
The flux and equivalent width (EW) of the emission line found can be obtained using the fluxes of the objects in the narrow and broad bands. The flux of the line is directly related to difference between the flux in the narrow band and the broad band and the EW is a function of the color. This can be seen also in Figure 1, where color and EW are in the y-axis. Exact formulae can be found in Pascual et al. (2001).
We have used multicolor data from the Wide Field Camera Survey, currently underway in the Isaac Newton Telescope. The WFS has taken images in five filters: U, g', r', i' and Z. The description of the filters can be found in the WFS pages.
These data has helped us improving the candidate classification in two ways. First, we have used the STELLARITY in the 5 photometric bands, giving a more reliable classification of the stars. Second, the combination of emission line and redshift makes possible that objects at higher redshifts appear in the narrow band filter. In our case, [OII]λ3727 at z∼1.2, Hβ at z∼0.68 and [OIII]λλ4959,5007 at z∼0.64 will al appear at wavelength 8200Å. In order to discriminate between genuine Hα emitters and potential sources of contamination, such as stars and other emission line objects we have adopted a photometric redshift approach.
Photometric redshifts (hereafter zphot) were computed thorough standard minimization procedure, using the public code hyperz (Bolzonella et al. 2002). For each object selected, the probability distribution and zphot have been derived by comparing the photometric Ug'r'i'Z spectral energy distribution to a wide set of template spectra.
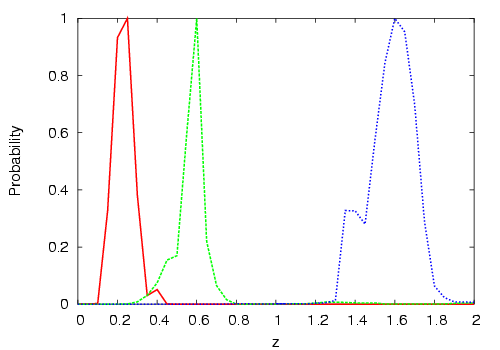
Figure 2: Examples of well defined probability distribution. They have been normalized to a maximum value of 1. The object peaking at z∼0.24 is b4-11002. The one near z∼0.6 is a3-561, and the distribution with a maximum at z∼1.6 is for a4-2734
The discrimination between Hα emitters and other sources was performed in two steps. Firstly, the galaxy-quasar versus star separation based on the value of the reduced χ². Objects rejected as galaxies or quasars and compatible with stars at 99% confidence level were removed from the sample.
In the second selection step, emission line objects were distributed in three into 3 redshift domains according to their zphot and probability distributions: z∼0.24, z∼0.64, and z∼1.2. Blue galaxies and quasars are often degenerate, i.e. a good fit can be obtained with both sets of templates.
In Figure 2 we show three typical probability distributions. In general the distributions for z∼0.24 and z∼0.64 are narrow, while the distribution around z∼1.2 is broader. To obtain a more accurate redshift determination for galaxies at this redshift (around z=1), it would be necessary photometry in the near-infrared.
After the determination of the redshift, we explored for each galaxy a 3-dimensional parameter space which consists of the SFR type, the age of the dominant stellar population and the extinction value. Two kinds of SFR were considered for these purposes: SSP and CSFR, both with Salpeter (1995) IMF. For this exercise, we used both the GISSEL00 (Bruzual & Charlot 1993) and the Starburst99 models (Leitherer et al. 1999).


Figure 3: Representative likelihood maps for a4-8934, belonging to the z∼0.24 sample, showing in dark the most probable regions and the degeneracy in the parameter space defined by SFR type, age and reddening
Figure 3 displays the likelihood maps corresponding to one typical galaxy in the z∼0.24 sample. The most probable region regions in the parameter-space are displayed in dark (permitted regions). The color table directly corresponds to the confidence level. In order to retain a good resolution at short time scale, a logarithmic scaling is used to display the age of the stellar population.
Based on the photometric redshift and STELLARITYs of the objects, we performed a classification in five groups: stars, galaxy at z∼0.24, galaxy at z∼0.6, galaxy at z∼1.2 and dubious objects, including candidates to quasars. With this classification, we have 13 stars, 33 galaxies at z∼0.24 and 6 dubious objects. We have found also 6 objects at z∼0.6 and 3 at z∼1.2.
In Pascual et al. (2001) we made a simple estimation of the probable number of [OIII]λ5007 and [OII]λ3727 and we found it negligible. We followed the method user by Jones & Bland-Howthorn (2001) to estimate the number of contaminants on their Tunable Filter Survey. The presence of these objects at these relatively bright fluxes implies a stronger evolution of the population of [OIII] and [OII] emitters than the corresponding to Hα.
In June and July 2003 we carried out spectroscopic follow up of a subsample of our candidates, with special interest in the contaminants at higher redshifts. We made our observations with TWIN at 3.5m and with ISIS at William Herschel Telescope at La Palma Observatory.
![Spectrum of three objects near [OII]λ3727](linea-oii1.jpg)
![Spectrum of three objects near
[OIII]λλ4959,5007](linea-oiii1.jpg)
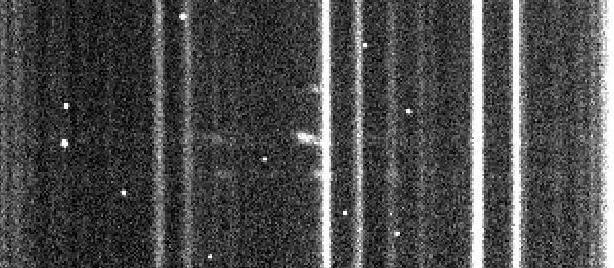
Figure 4: Emission line of the objects b4-11642, b4-11683 and b4-11519 in a spectrum taken with TWIN. On top [OII]λ3727, in the middle [OIII]λ5007. finally, Hα and [NII]λ6584 for b4-11643 and b4-11683
We could confirm that 15 (∼60%) of the objects observed are Hα emitters at z∼0.24 and 40 remain waiting for follow up spectroscopy. In Figure 4 we show three of the confirmed Hα emitters, the group formed by b4-11642, b4-11683 and b4-11519. A RGB composite image is shown in Figure 5. These images are built combining U in the blue channel, g in the green and r in red channel.
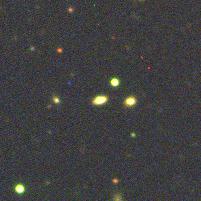
Figure 5: False color image, combining U, g and r. North is on top and east on the right. The tree objects are aligned from left to right and are b4-11683, b4-11643 and b4-11519
We have also confirmed the presence of 2 [OIII]λ5007 emitters. This confirms that the presence of contaminants is an important factor to be taken into account in future narrow-band surveys.
Using the properties of the emission lines found, we can build diagnostics diagrams. For example, in Figure 6 we show the excitation properties of the five galaxies that have simultaneously [OIII]λ5007, Hβ, Hα and [NII]λ6584 compared with the local reference of the UCM sample (Gallego et al. 1997). The diagram starts at the top left corner for the high-ionization, low-metallicity BCDs, and it ends at the bottom right corner for the low-ionization and high-metallicity objects. For out of five objects show disk-like excitation properties.
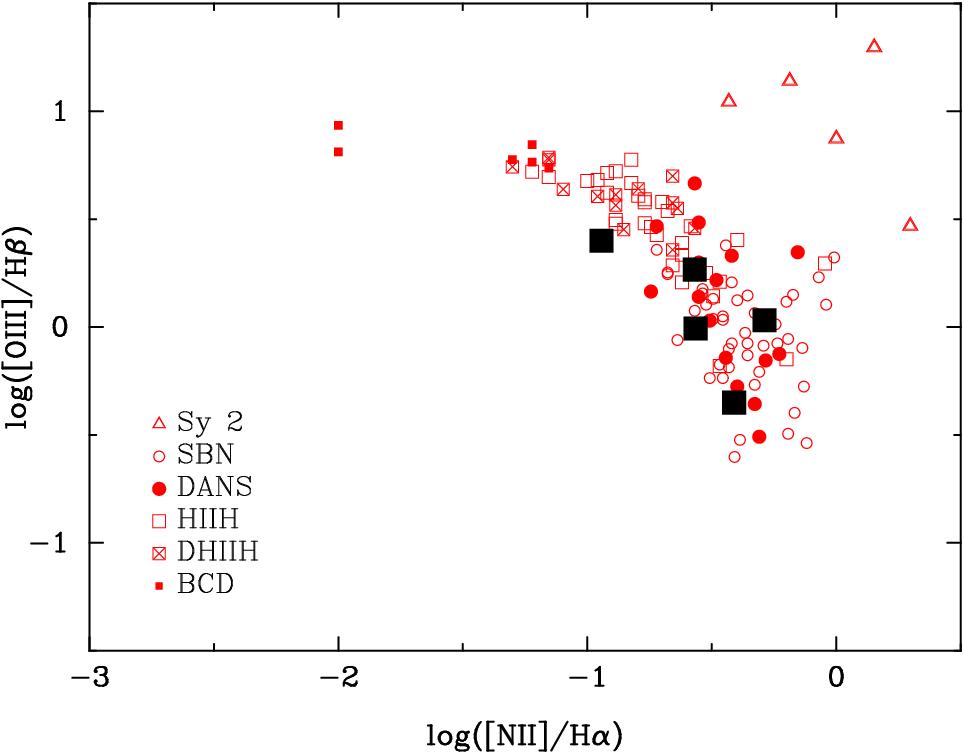
Figure 6: Diagnostic diagram for the z=0.24 sample of Hα emission-line galaxies (black squares). The local star-forming galaxies from the UCM sample (red symbols) are plotted for reference. Four out of five objects show disk-like excitation properties
We also show in Figure 7 galactic masses derived from velocity dispersion of the Hα line. The typical location of various galaxy typer are shown, including E/S0 and spheroidal galaxies, spirals, irregulars and local star-forming galaxies from the UCM sample.

Figure 7: Half-light radius (Re) versus velocity width (σ) for the z=0.24 sample of Hα emission-line galaxies (black squares). The typical location of various galaxy typer are shown, including E/S0 and spheroidal galaxies, spirals, irregulars and local star-forming galaxies from the UCM sample. Dashed lines correspond to constant masses of 108, 1010 1012 Msun
In these cases, the physical properties of these galaxies appear to be remarkably similar to those of local galaxies selected in the same way, i.e. by the Hα flux.
We have carried out a survey searching for emission line galaxies using CAFOS and a narrow-band filter centered at 8200Å. The total sky area covered was 0.19 square degrees within a redshift range 0.228 to 0.255. A total of 52 objects were selected as candidates.
Using the photometric redshifts and the STELLARITYs, 13 are classified as stars, 42 as galaxies and 6 are dubious classifications. Of the objects classified as galaxies 33 correspond to Hα emitters, 6 to [OIII]λ5007 emitters and finally 3 to [OII]λ3727 emitters. Five objects where not classified, as their Ug'r'i'Z magnitudes where not recovered from the INT-WFS catalogs. Only one object has a SED compatible quasar spectrum, but the classification is not clear.
The confirmed presence of 2 [OIII]λ5007 makes clear that the contaminants are very important in surveys with narrow-band filters.
The properties of Hα selected galaxies at z∼0.24 seems to be very similar to those of local galaxies selected in the same way. The results support the idea that the higher SFR density measured at redshift z∼0.24 is due to the increase of the density of galaxies and not to an intrinsic change on overall galaxy properties.
This work is part of the research developed by the Star Forming Galaxies group at the Departamento de Astrofísica, Universidad Complutense de Madrid.