Status
Javier López-Santiago, David Montes
Dpto. de Astrofísica y CC. de la Atmósfera,
Universidad Complutense de Madrid
Abstract
During five years (1999-2003), our group has been studying the spectroscopic properties of a large sample of stars members of the young stellar kinematic groups (SKG): Local Association (Pleiades moving group, 20 - 150 Myr), IC 2391 supercluster (35 Myr), Ursa Major group (Sirius supercluster, 300 Myr), Hyades supercluster (600 Myr) and Castor moving group (200 Myr). The high resolution spectroscopy used in this study allow us to better determine radial velocities, chromospheric activity and lithium abundance of these objects. A new set of possible chromospherically active binary stars has been obtained. Here we report the status of the spectroscopic survey, the selection of the sample and the first results on the kinematic and activity of the observed stars.
Introduction
It has long been known that in the solar vicinity there are several
kinematic groups of stars that share
the space motions of well-known open clusters.
Eggen (1994) defined a "supercluster" (SC) as a group of stars,
gravitationally unbound, that share the same kinematics and may
occupy extended regions in the Galaxy, and a "moving group" (MG)
as the part of the supercluster that enters the solar neighborhood
and can be observed all over the sky.
The origin of these stellar kinematic groups (SKG)
could be the evaporation of an open cluster,
the remnants of a star formation region
or a juxtaposition of several little star formation bursts
at different epochs in adjacent cells of the velocity field.
The youngest and best-documented SKG are:
the Hyades supercluster (600 Myr)
the Ursa Major group (Sirius supercluster) (300 Myr),
the Local Association or Pleiades moving group (20 to 150 Myr),
the IC 2391 supercluster (35-55 Myr), and
the Castor moving group (200 Myr)
(see Montes et al. 2001a, hereafter M01a, and references therein, or visit
our web page on MG).
The identification of a significant number of
late-type population in these young SKG
is extremely important for the study of the
chromospheric activity and could lead to a better understanding of
star formation history in the solar neighborhood.
With this aim, we have carried out a spectroscopic survey
of late-type stars (spectral types F-M) belonging to the MGs using high
resolution echelle spectra. The spectroscopic analysis of these stars allows
us to obtain a better determination of their radial velocity,
lithium (λ6707.8 line) equivalent width, rotational velocity
and the level of chromospheric activity.
Our first study was centred in the selection of a large sample of young late-type
stars possible members of SKG. Precise measurements of proper motions and parallaxes
taken from Hipparcos Catalogue (ESA, 1997), as well as from Tycho-2 Catalogue (Hog et al., 2000),
and published radial velocity measurements
were used to calculate the Galactic space motions (U, V, W)
and to apply the Eggen's kinematic criteria
in order to determine the membership of the selected stars in the
different groups. A total of 535 stars were selected in this first paper as
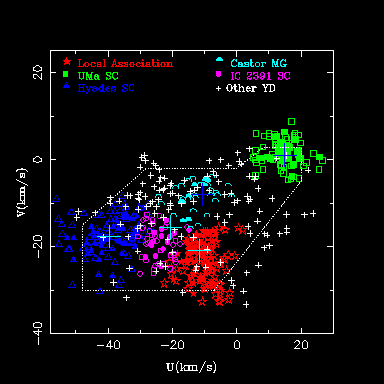
candidates. Fig. 1 shows their position in the UV-plane. Filled symbols
are stars satisfying both Eggen criteria (see M01a). Stars inside the boundaries
of the young stellar population which could not be asigned to none of the
young MG have been marked with cruxes in the figure.

Selection of the sample and observations
A total of 105 stars have been selected in M01a based on their kinematic
and chromospheric activity, as well as their spectral type.
Another 34 late-type stars with unknown radial velocity have been included
in the sample in order to establish their membership in any of the MGs
(see López-Santiago et al., 2003a).
In Table 1 we present the selected stars.
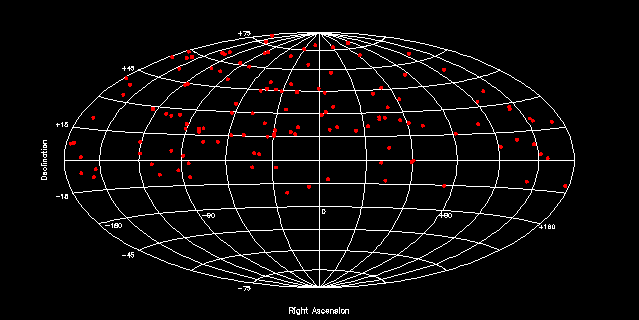
The sky covered by the sample range from -20° to
90° in declination and 0 to
24 hours in right ascension (see Fig. 2).
The high resolution spectroscopy used in this work, together with the
cross-correlation technique allows us to better determine the heliocentric
radial velocity of each star.
-----------------------------------------------------------------------------------------------------------
HD 166         HD 1405 *      HD 1326     HD 1835     HD 2410     QT And            HD 4568     HD 4614
HD 4614B       BD+17 232      HD 12230    HD 13382    HD 16525    HD 17190          HD 17382    HD 17925 *
HD 17922       HD 18632       HD 18803    HD 20678    HD 21845    HD 23232          HD 24916    HD 25457
HD 25680       HD 25998       HD 25665    HD 29697 *  HD 33564    HD 36869          HD 37394 *  HD 233153
HD 41593       TYC 1355-75-1  BD+20 1790  GJ 9251A    GJ 9251B    FP Cnc            HD 72905 *  HD 73171
HD 77191       HD 77407 *     HD 82558 *  HD 82443 *  BD+28 1779  GJ 378.2          DK Leo      AD Leo
GJ 393         HD 85270       HD 98736    GJ 426B     HD 102392   HD 105631 *       HD 238087   HD 238090
HD 106496      GJ 466         HD 110010   BD+21 2462  GJ 488.2    HD 112542         HD 112733   HD 115043 *
GJ 507.1       HD 238224      HD 117860   GJ 524.1    HD 125161B  HD 129333 *       HD 133826   HD 134319 *
HD 135363      HD 140913      HD 142764   HD 143809   HD 145675   HD 146696         CR Dra      HD 149661
HD 149931      HD 152863      HD 152751   HD 155674A  HD 155674B  HD 156984         V647 Her    GJ 678.1A
HD 160934      HD 162283      GJ 697      GJ 698A     GJ 698B     HD 165341         GJ 702B     HD 167605
HD 234601      SAO 9067       HD 168442   FK Ser      HD 171488   HD 171746         HD 173739   HD 173740
2RE J1846+191  GJ 734B        HD 184525   HD 187458   HD 187565   HD 191011         HD 197039   GJ 806
HD 198550      HD 200560      HD 200740   HD 201651   BD-05 5480  EUVE J2113+04.2   GJ 828.1    LO Peg
HD 205435      HD 206860      HD 208472   GJ 842.2    GJ 844      TYC 1680-01993-1  HD 209458   GJ 849
V383 Lac *     GJ 856B        HD 213845   BD+17 4799  EV Lac      HD 216899         HD 217813   GJ 9809
HD 220140 *    HD 221503      GJ 913
-----------------------------------------------------------------------------------------------------------
The spectroscopic echelle observations of the sampled stars
analyzed here were obtained during twelve observing runs.
About 75% of the stars were observed using FOCES spectrograph
mounted on the 2.2 meters telescope in CAHA (Almería, Spain).
The rest of the candidates were observed using other telescopes
(see Table 2) with resolutions similar to the obtained with FOCES.
Table 2: Observing log.
| Observing run | Wavelenght range | Resolution |
| (Angstroms) | (Angstroms) |
| 2.2m-FOCES (24 - 29 July 1999) | 3910 - 9075 | 0.09 - 0.26 |
| 2.2m-FOCES (21 - 24 September 2001) | 3510 - 10700 | 0.08 - 0.35 |
| 2.2m-FOCES (22 - 25 April 2002) | 3510 - 10700 | 0.08 - 0.35 |
| 2.2m-FOCES (01 - 06 July 2002) | 3510 - 10700 | 0.08 - 0.35 |
| INT-MUSICOS (18 - 22 January 2000) | 4430 - 10225 | 0.16 - 0.30 |
| INT-MUSICOS (5 - 11 August 2000) | 4430 - 10225 | 0.16 - 0.30 |
| INT-IDS (2 - 5 April 2001) | 3554 - 5176 | 0.48 |
| NOT-SOFIN (26 - 27 November 1999) | 3525 - 10425 | 0.14 - 0.32 |
| NOT-SOFIN (10 - 13 Novermber 2000) | 3525 - 10425 | 0.14 - 0.32 |
| NOT-SOFIN (21 - 29 August 2002) | 3525 - 10200 | 0.02 - 0.05 |
| TNG-SARG (10 - 11 October 2001) | 4960 - 10110 | 0.08 - 0.17 |
| HET-HRS (19 Dec 2001 -- 28 Feb 2002) | 5040 - 8775 | 0.15 - 0.28 |
Standard radial velocity stars used in the radial velocity determinations were observed in every observing run. The spectral type covered by these standards ranges from G to M, according to the spectral type of the stars in the sample. The spectra have been extracted using the standard reduction procedures in the IRAF package (bias subtraction, flat-field division and optimal extraction of the spectra). The wavelength calibration was obtained by taking spectra of a Th-Ar lamp. Finally, the spectra were normalized by a polynomial fit to the observed continuum.
First results
Radial velocities and Space motion
Heliocentric radial velocities were determined using the cross-correlation technique. For each observing run, the spectrum of each star is cross-correlated order by order, using the routine fxcor in IRAF, against spectra of radial velocity standards of similar spectral types observed in the same run. For each order, the velocity is derived from the position of the peak of the cross-correlation function (CCF) by fitting a Gaussian to the top of the function. Radial velocity errors are computed by fxcor based on the fitted peak height and the antisymmetric noise as described by Tonry & Davis (1979). The radial velocities calculated for each order are weighted by their errors, and a mean value is obtained for each observation. Orders including chromospheric features and prominent telluric lines were excluded when determining this mean velocity. If the star is observed more than once, a weighted mean radial velocity is determined using the results of each observation. Several stars have shown a clear variation in the velocity, possibly due to an undetected binary companion. They constitute a new set of possible chromospherically active binaries, and are been studied in detail by us.
The Galactic space-velocity components (U,V,W) have been calculated in the same way as in M01a: the procedures in Johnson & Soderblom (1987) to calculate U, V, W and their associated errors have been modified. The original algorithm (which requires epoch 1950 coordinates) has been adapted to epoch J2000 coordinates in the International Celestial Reference System (ICRS) as described in the Introduction and Guide to the Data (section 1.5) of the "The Hipparcos and Tycho Catalogues" (ESA, 1997). The uncertainties of the velocity components have been obtained using the full covariance matrix in order to take into account the possible correlation between the astrometric parameters. These coordinates have been combined with parallaxes and proper motions taken mainly from ''The Hipparcos and Tycho Catalogues" (ESA, 1997) and "The Tycho-2 Catalogue" (Hog et al. 2000), respectively, in addition with the heliocentric radial velocities determined. For stars with no measurement of the distance, a spectroscopic parallax has been calculated using the spectral types and luminosity class determined by us.
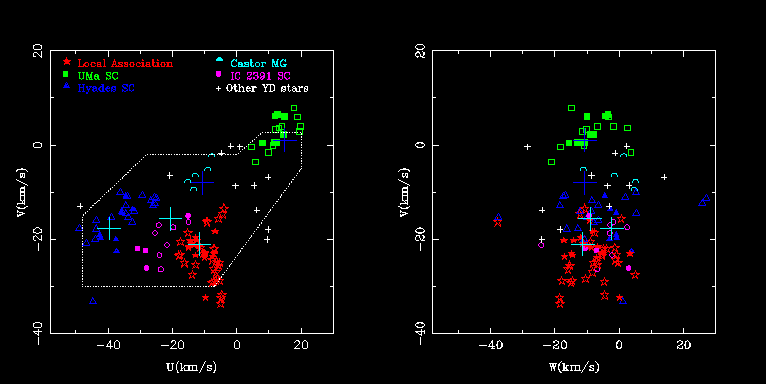
The results are plotted in Fig. 3. The candidates have been classificated
as possible members of any of the MG if its U and V components of the Galactic
velocity deviates in less than 10 km/s from the central point of the MG.
For the 139 stars of the sample, a total of 111 have been classified as
possible members of the MGs:
48 of the Local Association,
28 of the Hyades supercluster,
19 of the Ursa Major moving group,
11 of the IC 2391 supercluster,
and 5 of the Castor moving group.
We have identified another 11 young disk stars which classification is not
clear but are situated inside or near the young disk population boundaries.
In addition, we have calculated the Eggen's kinematic criteria
of deviation of the space motion
of the star from the convergent point (peculiar velocity, PV)
and comparison between the observed and calculated (ρc)
radial velocities (see M01a). Stars satisfying both Eggen's criteria are
plotted with filled symbols in Fig. 3.
It is easy to see that our criteria are less restrictive than the
Eggen's one.
Estimation of age: the Li I λ6707.8 line
The resonance doublet of Li I at λ6707.8 angstroms
is an important diagnostic of age in late-type stars
since it is destroyed easily by thermonuclear reactions in the
stellar interior.
In order to obtain an estimate of the ages of our stars
we compare their EW(Li I) with those of stars
in well-known young open clusters of different ages.
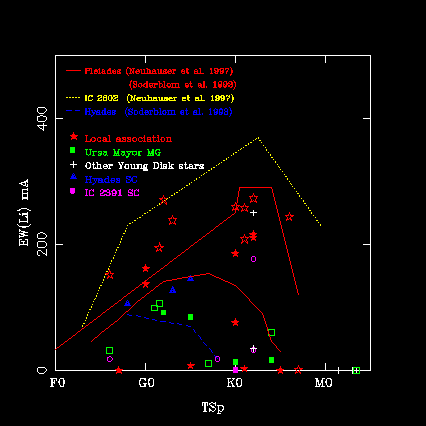
In the EW(Li I) versus spectral type diagram (Fig. 4)
we have overplotted the upper envelope of the Li I EW
of IC 2602 (10-35~Myr), the Pleiades (78-125~Myr), and the Hyades (600~Myr),
open clusters which cover the range of ages of the MGs studied here.
Stars are plotted with different symbols depending on the MG they have
been classified on using their kinematic (see section above).
The comparison with the stellar clusters of well-known age
shows the existence of young and not so young stars mixed in the sample.
Chromospheric Activity
The echelle spectra analysed allow us to study the behaviour of the different optical chromospheric activity indicators from the Ca II H & K to the Ca II IRT lines, formed at different atmospheric heights. With the simultaneous analysis of the different optical chromospheric activity indicators and using the spectral subtraction technique, it is possible to study in detail the chromosphere, discriminating between the different structures: plages, prominences, flares and microflares. The chromospheric contribution in these features has been determined using the spectral subtraction technique described in detail by Montes et al. (1995; 1997; 1998, 2000). The synthesized spectrum was constructed using the program STARMOD developed at Penn State University (Barden 1985) and modified by us. The inactive stars used as reference stars in the spectral subtraction were observed during the same observing run as the active stars.
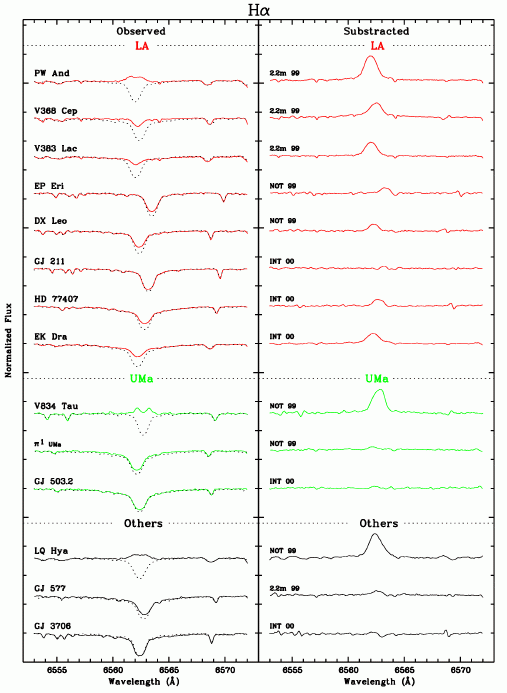
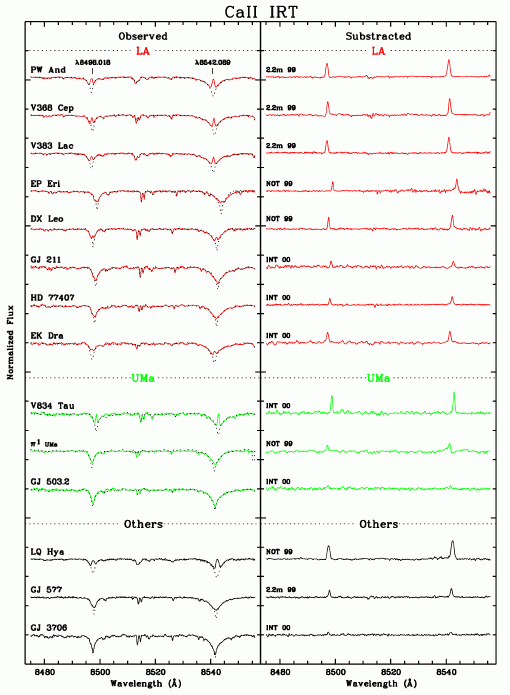
Representative spectra in the Hα
and Ca II IRT (λ8498, λ8542) line regions
of some of the stars (marked with * in Table 1)
have been plotted in Figs. 5 & 6.
For each star we have plotted the observed spectrum (solid-line) and the
synthesized spectrum (dashed-line) in the left panel
and the subtracted spectrum in the right panel.
Hα emission above the continuum is detected in several stars
(Montes et al. 2001b (M01b)).
| 
|
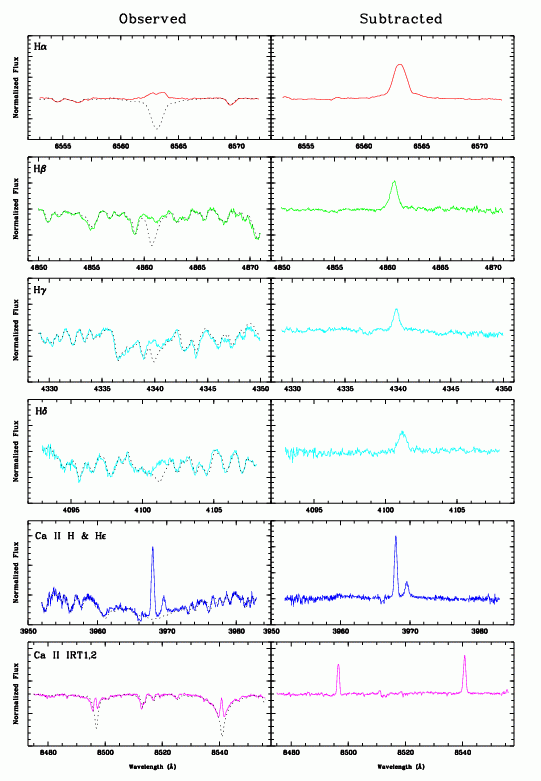
Fig. 7 shows another example of the results obtained for the young active K2-dwarf
PW And. The chromospheric activity indicators Hα, Hβ, Hγ, Hδ and Hε
as well as Ca II H and IRT have been plotted for comparison.
Rotation-activity relation
When we analyse in detail the behaviour of the chromospheric excess emissions
with the star rotation
(characterized by their photometric period, Pphot or their
projected rotational velocity, vsini)
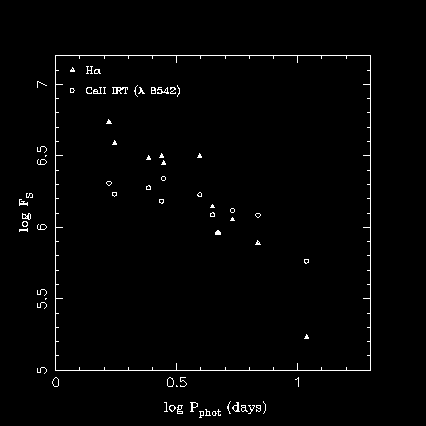
a clear trend of increasing activity with increasing rotation is revealed.
This can be seen in Fig. 8, where we have plotted
the absolute flux at the stellar surface (log Fs)
in the Hα, and Ca II IRT lines
versus the photometric period (log Pphot).
This behaviour confirms that this group of young stars
also follows a rotation-activity relation similar to that observed
in other kinds of active stars (see Montes et al. 1995), and in stars
members of young open clusters (see Simon 2001, and references therein).
Surface features
One of the most interesting aspects of the resolution of our observations is
the possibility of the study of features (dark cool spots) on the photosphere
of the active stars.
To study spectroscopic variations produced by spots we have used the
fact that cool spots moving across the disk of a star will produce a
weaker contribution to the total integrated line profile.
Thus the spectra -integrated over the disk will show
a bump traveling across the profile as the star rotates.
Two methods are commonly used to interpret this information:
Doppler imaging and bisector analysis. These two techniques
need both high resolution and high signal-to-moise ratios, more
than the obtained in our observations. Nevertheless,
a powerful method was developed and applied to several stars in the
range of 15 < v sini < 40 km/s
by Dempsey et al. (1992) using a correlative analysis. A
non active star (template) is cross-correlated with the active star producing
a cross-correlation function (CCF). Variations in the peak of the CCF are
related to changes in the line profiles caused by spots. To quantify the
temporal variations in the CCF the bisector of the peak of the CCF can
be calculated. This CCF bisector is not the same as the bisector
described by Toner & Gray (1988), since the bisector of a line
measures velocity fields while the CCF bisector quantifies the asymmetry of
the CCF.
The best results are
obtained when both template and active stars have a similar spectral type.
The advantage of this technique is the possibility of using many absorption
lines for the calculation of the CCF (Dempsey et al. 1992). As the information
of the lines is redundant, there is less restriction in the
S/N (< 150). Resolution of λ/Δλ = 40000 is
sufficient to obtain accurate results. We employ this latter technique to
study the effects of star-spots on the profiles of photospheric
lines in PW And (see López-Santiago et al., 2003b).
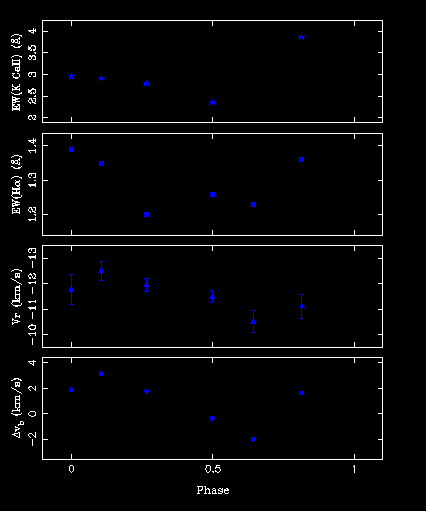
When arranged in phase, the EW(Hα) and EW(Ca II H & K)
appear to follow a clear sequence for each observing run.
Comparison with results from the CCF bisectors shows a correlation
between photospheric and chromospheric activity.
Thus, the chromospheric active regions appear to be associated to the
photospheric features (see Fig. 10).
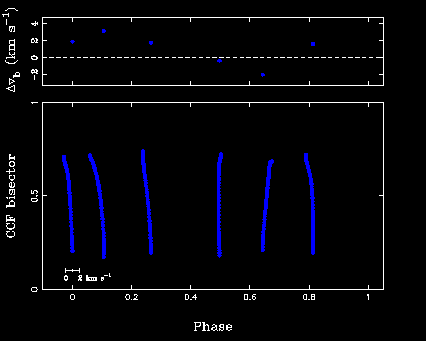
In Fig. 9 we show the variation in the bisector of the CCF in the
2.2m-FOCES (24 - 29 July 1999) observing run with the photometric phase.
Some useful links
References