![]()
![]()
|
We present the first spatially resolved spectroscopic observations
of the recently discovered quadruple QSO and gravitational
lens HE 0435-1223. Using the Potsdam Multi-Aperture Spectrophotometer (PMAS),
we show that all four QSO components have very similar but not identical spectra.
We also introduce some novel techniques for the analysis of integral
field spectroscopic observations of gravitationally lensed quasars in general.
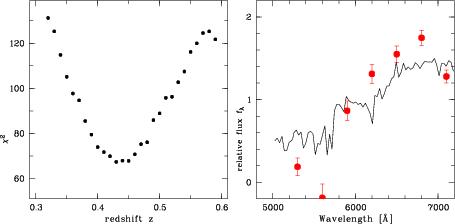
Finally, we present a detection of the lensing galaxy, although this is close to the limits of the data. Comparing with a model galaxy spectrum, we obtain a redshift estimate of z_lens = 0.44 +- 0.02.
A full account of this work and the relevant references can be obtained
in the recently completed paper by L. Wisotzki et al., Astronomy and
Astrophysics 2003, in press.
|
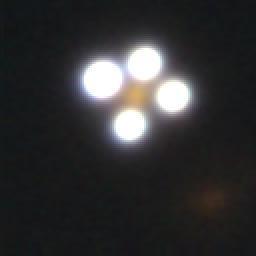
| HE 0435-1223 was first discovered in the course of the Hamburg/ESO survey for bright QSOs (Wisotzki et al. 2000) and recently found to be a rather spectacular example of a quadruply imaged QSO (Wisotzki et al. 2002). The quasar is at a redshift of z = 1.689 and had a total magnitude g = 17.8 at the epoch of discovery, with evidence for significant variability. A composite colour image obtained with the 6.5m Magellan telescope is shown right. There can be no doubt about the nature of this object as being gravitationally lensed. However, so far there are no resolved spectra available of the individual components. |
|
|
HE 0435-1223 was targeted with PMAS during the first regular (non-comissioning)
observing run of the
Potsdam Multi-Aperture Spectrophotometer (PMAS),
mounted at the Calar-Alto 3.5 m telescope for several nights between
2--7 September, 2002.
The image scale was 0.5 arcsec per spatial pixel, the total field of view
was 8 arcsec x 8 arcsec. We used the V300 grating,
giving a spectral resolution of 6A FWHM and a spectral
range from 3950A to 7250A.
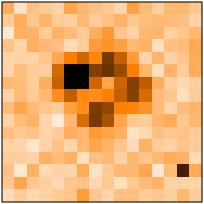
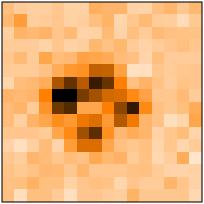
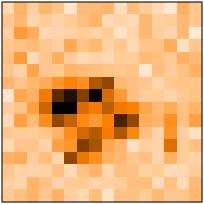
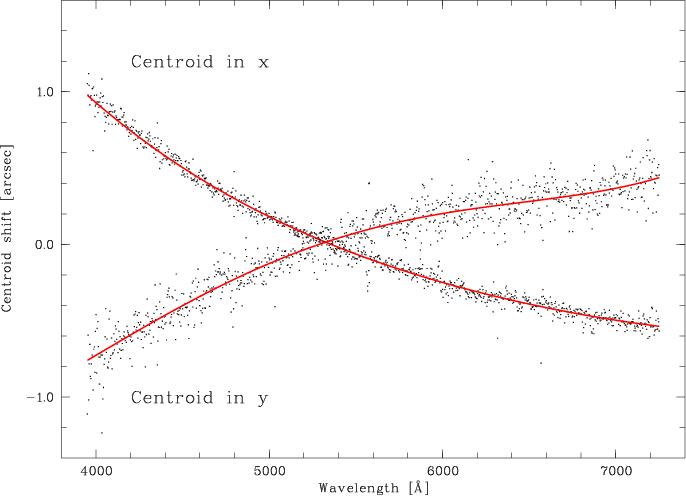
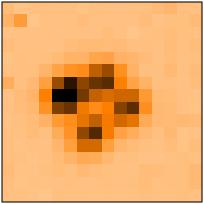
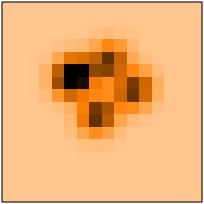
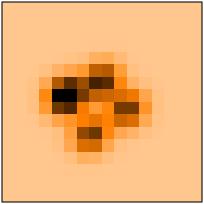
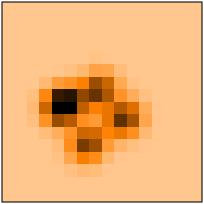
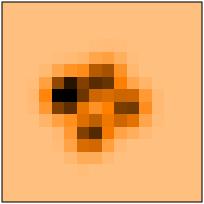
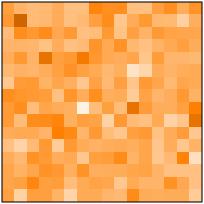
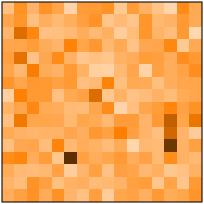
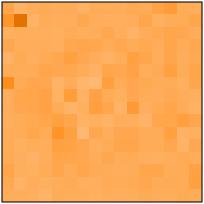
At the observing date in early September, the target became visible only very shortly before morning twilight, and only at airmasses of around 2. We revisited the object repeatedly and could record useful data at the end of three different nights, with a total exposure time of 6600 s. The external (DIMM) seeing was usually around or slightly below 1 arcsec. The data were reduced with the IDL-based package P3d. Below we show three quasi-monochromatic images (bandwidth 3.3A), obtained at three different wavelengths. The orientation is standard (North is to the top, East is to the left). The four QSO components are clearly resolved. Notice the strong shift of image centroids as a function of wavelength, caused by differential atmospheric refraction. |
| lambda = 4278 | lambda = 5601 | lambda = 6924 |
| 
| 
|
|
Ansatz: Approximation of each QSO image as single elliptical Gaussian.
--> 4 x 6 = 24 free parameters per slice. In order to reduce the number of
free parameters, we derive constraints. Initial (a priori) constraints are:
- All point sources have same shape. The relative image separations are known from the Magellan astrometry.
This is followed by a multi-step procedure:
|
|
|
3. Redo the fit, now with 3+4 = 7 parameters.
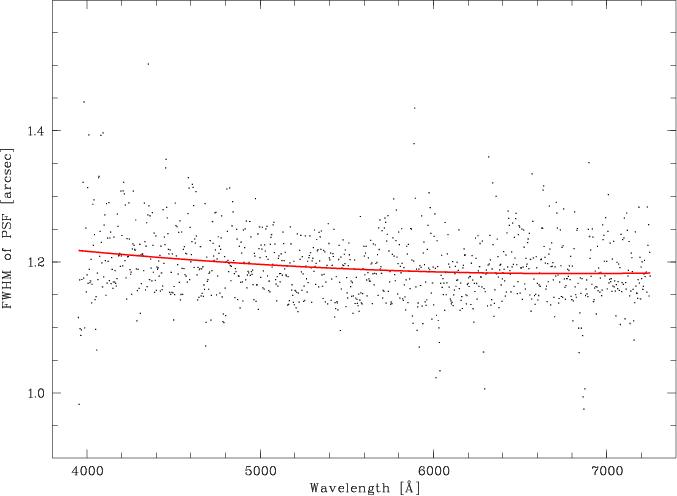
4. Replace position angle of PSF by mean value. 5. Redo fit, now with 2+4 = 6 parameters. 6. Replace fwhm(x) and fwhm(y) by smooth polynomials (see figure) 7. Final fit with only 4 amplitudes as parameters. |
|
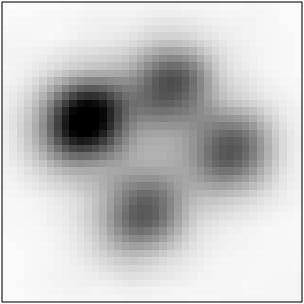
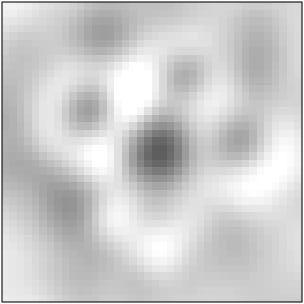
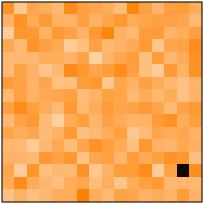
| The outcome of this algorithm is first displayed in the imaging domain below. We show the same three monochromatic slices as above, plus a simulated broad-band image (top row); the fit images for the same datasets (middle row); and the residuals data - fit (bottom row). Notice that the residuals are consistent with pure shot noise. |
| lambda = 4278 | lambda = 5601 | lambda = 6924 | lambda = 5000-6000 |
|
|
|
| 
|
| 
| 
| 
|
| 
| 
| 
|
|
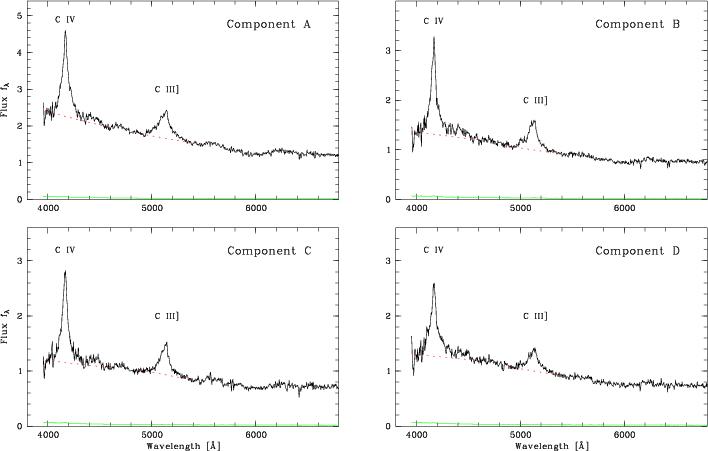
Now we show the extracted, calibrated and coadded spectra of
the four QSO components. The green lines near zero represent
the 1sigma error arrays. Notice that the S/N ratio of the spectra is quite high,
up to 60 in the brightest component A. The adopted local continuum levels,
used to derive emission line properties, are indicated by
the red-dashed line segments.
The spectral slopes of components A, B, and D are indistinguishable, implying that extinction due to dust plays no major role in the lensing galaxy. On the other hand, the strengths of the emission lines relative to the continuum are quite different in the four components. We argue that most likely, microlensing is responsible for this phenomenon (see the full paper for details). |
|
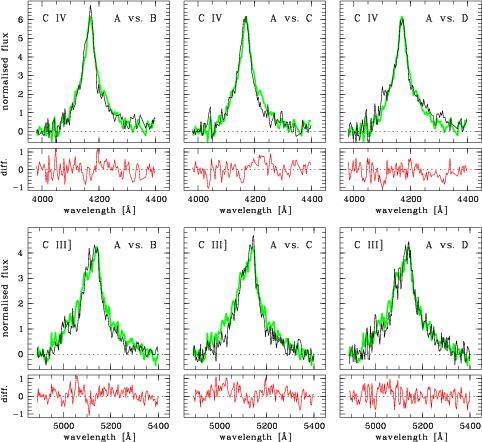
Below we show sets of pairwise comparison of normalised emission
line profiles, obtained after subtracting a local continuum level.
The upper row shows the C IV, the lower row the C III] lines.
In each panel, the thick green lines represent component A,
while the black thin lines denote components B, C, and D, respectively.
Below each panel we show also the difference between the profiles.
The main conclusion here is that also the emission line profiles are identical within the error bars, exactly as expected from gravitational lensing. Furthermore, the identity of the line profiles makes it very unlikely that microlensing can be a major effect for the broad line region in this QSO.
Image Supersampling and Detection of The Lensing Galaxy
|