Twilight at Calar Alto - Sky brightness variation

S. Pedraz


The advantage of twilight flatfields over internal lamps or dome flatfields is a well known topic. But the acquisition of this kind of images has some peculiarities. It must be performed in a particular and short period of time, because only a fraction (roughly a third) of the astronomical twilight is useful. Before and after, the sky is too bright or too dark. Moreover, current large format CCDs have long readout times. For these reasons, if we want to predict the proper exposure time at a moment and to optimize the number of possible exposures, we need to know how the sky variates. In principle a simple analytic expression as the one provided by Tyson & Gal (1993) should be enough to determine a series of twilight flatfields.
In order to analyse empirically the sky brightness variation during the twilights, we made use of the flatfields frames taken for the observing runs, carried out in service mode, between June 27 and September 23 1999, at the 1.23m telescope . At the end of this page there is a tool for observers to plan twilight flatfields sequences.
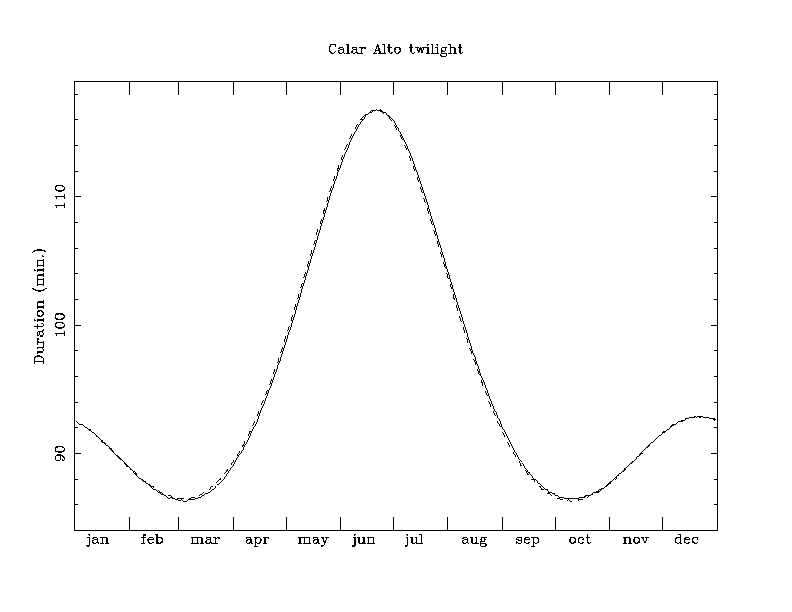
Fig 1: Variation of astronomical twilight length during the year. The continuous line indicates the dawn twilight and the dashed line the dusk twilight.

Show today's twilights times


A total amount of ~500 images were obtained with four different CCDs and two filters (see table 1). The mean signal level and deviation was measured in an area of 200 by 200 pixels in the center of the image. After bias substraction and cosmic rays removal for CCDs of different pixel size (15 and 24 microns), the area and signal level were scaled to a common value, to make data comparable and avoid differences coming from spatial profiles. Discarding those frames with a signal below 4000 ADUs or out of the linearity regime, and the ones with hight deviation, 441 frames remain.
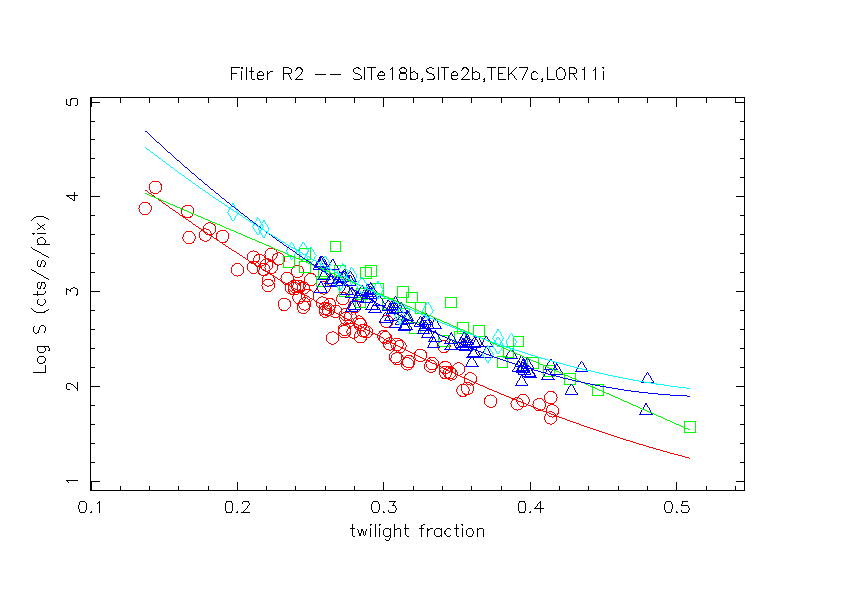
To compare all the data at once, we have to take into account that astronomical twilight duration depend on the date for every latitude (see Fig 1). Hence the rate at which the Sun approaches (or move away) the horizon and the sky brightness variation depend also on the date. Then, instead of plotting directly the signal versus local time or the elapsed time from twilight start to exposure start (evening) we prefer to plot signal against the fraction of astronomical twilight (TF) elapsed as in figures 2 and 3. Also, to compare together evening and morning data, the latest are folded, i.e. for evening flatfields the twilight fraction is the elapsed time from the beginning of the twilight to the exposure start and for the morning flatfields is the time from the exposure start to end of twilight.
Fig 2: Log of sky brightness in counts per pixel per second vs the twilight fraction. This fraction is the elapsed time between twilight start and the exposure start in the evening or the other way around in the morning. Filter Johnson R is used with the CCDs: SITe18b red circles, SITe2b green squares, TEK7c dark blue triangles and LOR11i light blue rhombs. Lines are a second order polynomial fitting to every CCD data.
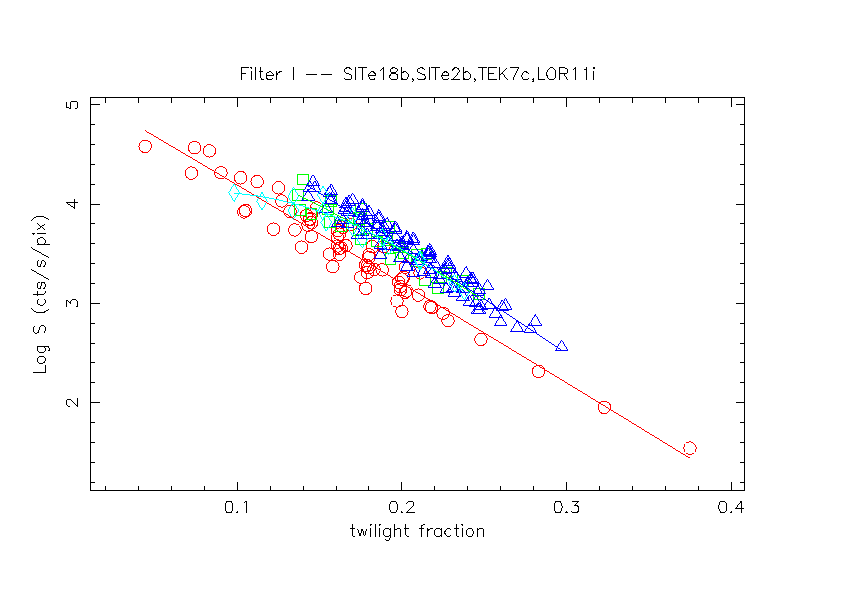
Fig 3: Same as figure 2, but for filter Johnson I. Comparing with the previous figure, data are now displaced to the bright twilight side.


A first question is if a linear fitting is suitable or a second order polynomial, as the lines drawn in figures 2 and 3, could be justified for physical reasons. Table 1 show the deviations from both fittings. There are several reasons for the deviations deviations. Different atmospheric conditions, differend regions of the sky pointed at, or calculating the twilight fraction from the time when exposure start instead of from the moment in the middle of the exposure , mainly when mixing morning and evening twilight. Considering these reasons, we could say that the residuals from a second order polynomial fitting (res2) are not significantly smaller than the linear fit (res1).
For every single day we have from 4 to 10 flatfield exposures with the same CCD and filter combination. After measuring in each one the mean signal as counts per pixel per second (S), we have plotted the logarithm of these values (log S) versus the elapsed twilight fraction (TF) and fitted a first order polynomial (log S = C + K*TF) to these points, obtaining the coefficients C and K. The values of C and K shown in table 1 are the average of these coefficients for the different nights that the same combination of CCD and filter was used.


Table 1: Number of images for every CCD+filter combination and coefficients for a linear fit (Log S = C + K*TF) of the signal as function of the twilight fraction (TF). Last two columns give the deviation from a first (res1) or second (res2) order polynomial fit.

CCD Filter N Images C K res1 res2
  SITe 18b R2 83 5.045 -8.353   0.119 0.109
  SITe 18b I 67 5.190 -9.950   0.141 0.142
  SITe 2b R2 32 4.977 -6.738   0.128 0.130
  SITe 2b I 29 5.383 -9.296   0.106 0.108
  TEK 7c R2 87 4.847 -6.641   0.102 0.081
  TEK 7c I 109 5.721 -10.704   0.099 0.100
  LOR 11i R2 18 5.243 -7.500   0.078 0.066
  LOR 11i I 16 4.986 -7.353   0.102 0.074


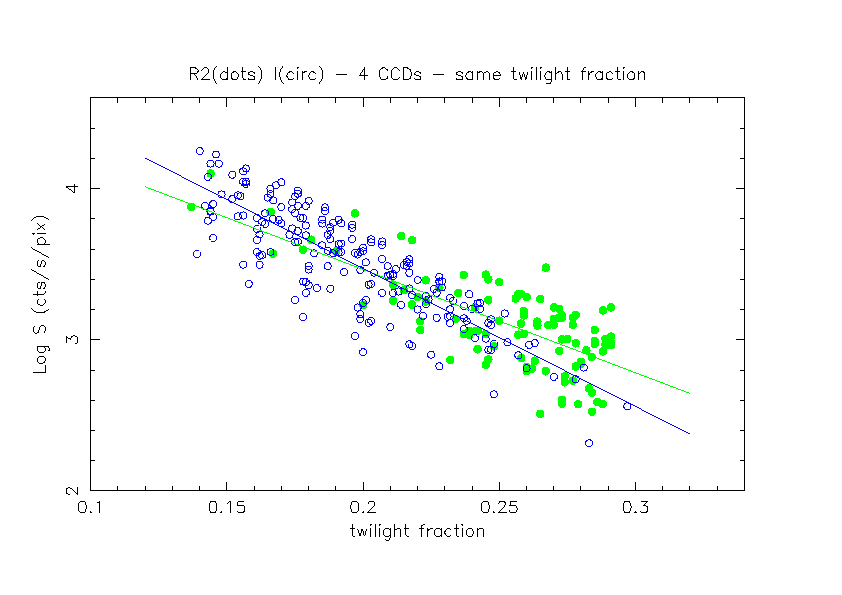
The data show clearly that the brightness variations are faintest at the end of the evening twilight and at the beginning of the morming twilight (compare fig.2 and fig.3). But it has to be taken into account that the exposures for different filters, due to their different band widths, are carried out sooner or later. Then, the question is if the sky brightness changes faster at the beginning of the evening twilight (end of the morning twilight), or if this rate depend on the wavelength. From figure 4 becomes clear that the latest is the case. In this figure we show the data from the two filters (R and I) in a common period of time. It can be seen that the fitting to the I filter points has a higher slope than for the R filter. There is a high spread of points for each set of data because the four CCDs, with their different efficiency, are plotted together.
Table 2. show the rate of the sky brightness variation for filters R and I. These values are obtained after fitting all the points for every CCD+Filter setup and calculating the mean of the four CCDs for every filter.
Fig 4: Linear fit (Log S= C + K*TF) for two sets of data in a common period of the twilight. Green dots represent data from filter R2 and blue circles filter I


Table 2: Log S(ADUs) = C + K* TF

Filter N Images C K
R2 220 5.07 -7.32
I 221 5.34 -9.27


Once we have measured the rate of change of sky brightness during the twilight, the values of Table 2 can be used to predict the exposure time needed to obtain in a second flatfield the same signal than in a previous one.


Filter
Date
Month Day
First Exposure
Hour Min. Exp.Time
Second Exposure
Hour Min.
Exp.Time