|
The near-IR imaging data were collected at the Calar Alto 3.5-m telescope using Omega-Prime, the optical imaging data at the Calar Alto 2.2-m telescope using CAFOS, with some additional optical imaging at the McDonald Observatory 2.7-m telscope using IGI. Spectroscopic follow-up observations are in progress using MOSCA at the 3.5-m for complete sampling to K'=17, and FORS at the VLT for a deeper pencil-beam.
Directly observing the evolution of individual galaxies with time is, unfortunately, not possible. Therefore we must rely on investigating the statistical properties of the whole galaxy population as a function of redshift, trying to draw conclusions from ensemble properties on the evolution of typical members of these ensembles, and thus facing difficulties, like, for example, discriminating between luminosity evolution and number density evolution.
Much work has been invested in this field, resulting in a lot of progress in the last decade which has seen many imaging and redshift surveys being undertaken using different selection techniques in wave-bands from the UV to the sub-mm. These surveys have a wide range of scientific applications, from the detection of high-redshift galaxy clusters to the study of the evolution of `normal' field galaxies.
The earlier optically and near-IR selected redshift and imaging surveys, laid the path to the landmark CFRS (Canada-France Redshift Survey; [Lilly et al.1995a]), an I-band selected redshift survey mapping the evolution of the galaxy population out to z~1. Also many `pencil-beam' surveys have been carried out, the most prominent being the Hubble Deep Field North and South [ Williams et al.1996] and their ground-based imaging and spectroscopic follow-ups, allowing us a first glimpse at the galaxy population at 2.5 < z < 4.5. The disability to determine redshifts spectroscopically for all objects where multi-band imaging data is available (because of limited telescope resources, either in observing time or in collecting area), caused photometric redshift determination techniques to gain attention again [ Baum1962, Koo1985, Fernández-Soto et al.1999, Benítez2000]. This, and the wide-field imagers becoming available in the optical and also in the near-infrared wavelength regime, made multi-band imaging surveys a very promising option for further studies in galaxy evolution.
Selection in whatever pass-band introduces different (and sometimes subtle) selection effects, a well-known fact which need not necessarily be considered at the disadvantage of the resulting object database, as long as the selection function is well-understood and under control. These selection effects can be used deliberately for probing different galaxy populations and different aspects of their evolution. While selection in blue pass-bands is used to study star forming sources, selection in the near-IR is predominantly sensitive to the light of old stellar populations. Near-IR k-corrections are small even at redshifts above unity and insensitive to the spectral type of the observed objects [ Cowie et al.1994] and to short-lived bursts of star formation, as has been pointed out by . Thus near-IR selected surveys are thought to be much less biased with respect to the mix of spectral types compared to optically selected surveys. Furthermore, the uncertainties resulting from inhomogeneous dust absorption are minimal in the near-IR. It has therefore been concluded that near-IR selection is a feasible attempt at a selection in stellar mass [ Rix & Rieke1993, Brinchmann & Ellis2000].
The Munich Near-Infrared Cluster Survey (MUNICS) is an attempt at closing the gap between previously undertaken infrared-selected deep pencil-beam surveys [ Gardner et al.1993, McLeod et al.1995, Cowie et al.1994, Djorgovski et al.1995, Williams et al.1996, Saracco et al.1997] and relatively shallow wide-area surveys [ Mobasher et al.1993, Glazebrook et al.1994, Gardner et al.1997], simultaneously profiting from the advantages of near-infrared selection.
MUNICS is a wide-area, medium-deep, photometric survey selected in the K' band. One part of the surveyed fields was centred on known quasars, while the rest was randomly selected at high Galactic latitudes. It covers an area of roughly one square degree in the K' and J bands with optical follow-up imaging in the I, R, and V bands for a large fraction of the total surveyed area.
The resulting object catalogues are strictly selected in K' with a limiting magnitude of K'~19.5 mag and J~21 mag, sufficiently deep to detect passively evolving systems up to a redshift of z < 1.5 and luminosity of 0.5 L* (see Fig. 1). The optical data reach a depth of roughly R~23.5 mag. The near-IR imaging data were collected at the Calar Alto 3.5-m telescope using Omega-Prime, the optical imaging data at the Calar Alto 2.2-m telescope using CAFOS, with some additional optical imaging at the McDonald Observatory 2.7-m telscope using IGI. Spectroscopic follow-up observations are in progress using MOSCA at the 3.5-m for complete sampling to K'=17, and FORS at the VLT for a deeper pencil-beam.
The project's main scientific aims are the following. First, to identify clusters of galaxies at high redshift by detecting their luminous early-type galaxy population. As has been shown in the last years, the early-type galaxy population in clusters is well in place at redshifts of at least 0.8 [ Stanford et al.1995, Stanford et al.1997, Stanford et al.1998, de Propris et al.1999]. Given the small k-corrections in the K band, this makes selection in the near-IR a promising approach to detect clusters at redshifts around unity, complementing selection in other optical bands. Clusters of galaxies allow to find large numbers of massive galaxies at higher redshift and thus represent unique laboratories to study the evolution of galaxies in high-density regions as a function of redshift, and in contrast to the evolution of similar galaxies in the field. Furthermore, the evolution of the number density of clusters is a promising test of cosmological models, depending sensitively on the density parameter Omega [ Eke et al.1996, Bahcall et al.1997, Bahcall & Fan1998, Eke et al.1998]. While the number of clusters known at redshifts z > 0.5 is steadily increasing (mostly due to X-ray selection), samples selected uniformly in the optical and near-IR wavelength ranges are still deficient.
Cluster detection at high redshifts is strongly biased towards the most massive systems, mainly because of lack of detection sensitivity for lower mass systems. Finding also less massive systems is important when reasoning about hierarchical galaxy formation models, since the galaxies in the densest environments also formed earlier, so by looking only at the most dense environments one is effectively pushing the epoch of collapse, merging, and star formation out to higher redshifts and further away from the observational window. Therefore we decided to centre a subset of the MUNICS fields on known quasars hoping to increase the chance of detecting clusters in their environment.
Secondly, a statistically well-defined sample of the early-type galaxy population in the field can be constructed from our catalogues, which will be used to study the evolutionary history of such objects in the redshift range 0 < z < 1 by means of the K-band selected luminosity function, the luminosity density at near-infrared wavelengths, and the two-point correlation function. Again, K-band selection offers unique opportunities due to the close connection between near-IR luminosity and stellar mass [ Brinchmann & Ellis2000], and thus allows a direct assessment of the predictions of hierarchical galaxy formation theories.
Thirdly, the nature of extremely red objects (EROs; ) will be examined. EROs, usually defined in terms of their very red R-K = 5..6 colour at moderately faint K-band magnitudes of K~18, are thought to be either high-redshift early-type galaxies or heavily extincted starburst galaxies [ Cimatti et al.1999, Smail et al.1999], the relative contribution of the two sub-populations being yet highly uncertain. Due to the small areas of the surveys available so far, even the surface density of these objects is not reliably known [ Thompson et al.1999]. Since they mostly are R-band `dropouts', having the possibility to detect such objects in the MUNICS data in the I and J bands, together with the large field covered, will enable us to gain valuable information on their nature.
|
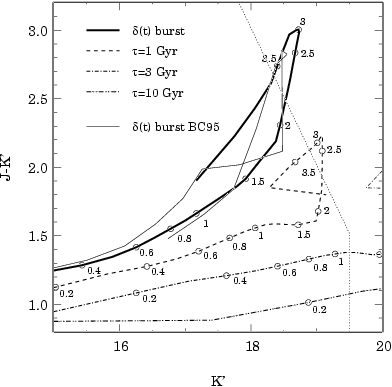
Fig. 1 shows stellar population synthesis models in the J-K' vs. K' plane for different star-formation histories, an infinitely short burst at z=4, and 3 exponential star formation rates with e-folding times of 1, 3, and 10 Gyr, setting in at z=4. The models are normalised to have a luminosity of L* in the B band at the present epoch, according to the type-dependent luminosity function of the Virgo cluster (see text) as given by Sandage, Binggeli, & Tammann (1985). The thin dotted line indicates the limiting depth (50 per cent completeness) of the MUNICS data in J and K'. The adopted cosmology is H0=65, Omega_0=0.3, Omega_Lambda=0.7. The SSP models used in the synthesis are from Maraston (1998). The adopted values for L* are L*_B=-21.5 for the SSP model (elliptical/S0 galaxy), L*_B=-20.5 for the 1 Gyr exponential (Sa-Sb spiral), M*_B=-19.5 for the 3 Gyr exponential (Sc), and L*_B=-17.5 for the 10 Gyr exponential 10 (Sd or later). The adopted cosmology is H0=65, Omega_0=0.3, Omega_Lambda=0.7.
Following the predictions of these models, the limiting magnitudes in the near-IR wave-bands have been chosen to be 19.5 mag in K' and 21.0 mag in J, such that early-type objects having luminosities of > 0.5 L* at the present epoch can be detected in K' virtually at any redshift, and in J up to a redshift of z < 1.5, assuming passive evolution.
This proceeding can be justified by the findings of the CFRS, which has shown that, while the luminosity function of the population of blue field galaxies shows significant signs of evolution in the redshift range 0.2 < z < 1 - explainable by brightening or increase in space density - the redder part of the population (roughly redder than Sbc) shows no signs of evolution of its luminosity function in the same redshift range [ Lilly et al.1995b].
 |
 |
 |
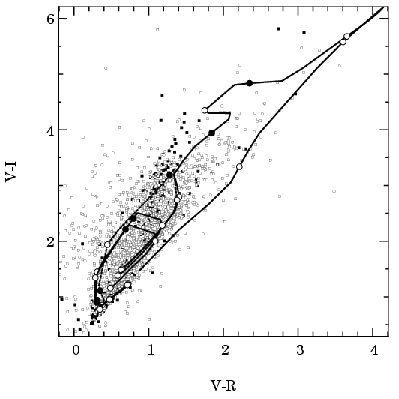 |
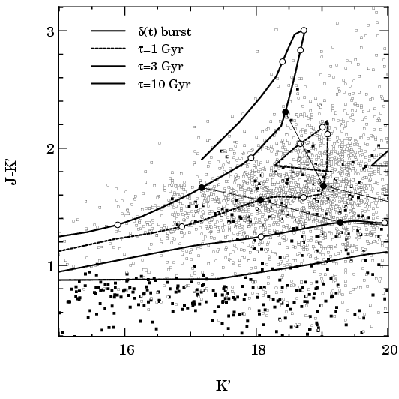
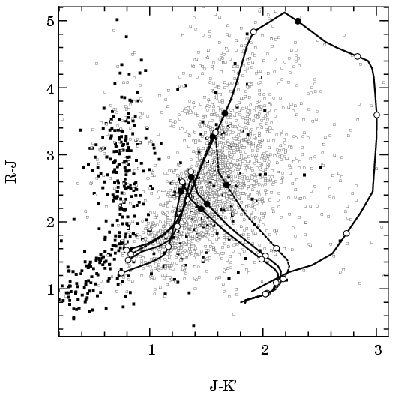
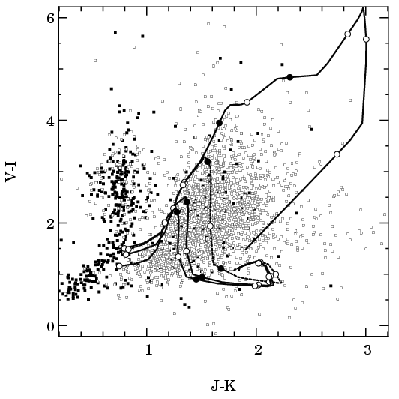
In Fig.2 we show the J-K' vs. K colour-magnitude diagramme and the R-J vs. J-K', V-I vs. J-K', and V-I vs. V-R colour-colour diagrammes for MUNICS data from three mosaic fields. The total number of objects shown is 2977, 286 of which are classified as point-like. These plots also contain the tracks defined by the stellar population synthesis models described in detail in Sect. 2.2. Briefly, the models are an SSP, and three exponential star formation histories with e-folding times of 1, 3, and 10 Gyr forming at z=4. The models have been normalised such that they represent typical L* objects at z=0, with L* chosen according to their `photometric' Hubble type (see above).
These models reasonably envelope the region in the colour-magnitude J-K' vs. K' plane occupied by the data, with the SSP model following the outline of the data points along the bright and red edge as might be expected since any further star formation or a later formation epoch would render the object bluer relative to the SSP.
It is also worth noting that the models constitute a continuous sequence with the duration of the star formation as the parameter in the R-J vs. J-K' plane, closely following the SSP track up to a redshift of roughly 1, then rapidly turning bluer in R-J while still getting redder in J-K'. A significant fraction of objects between the SSP and the 1 Gyr track is compatible with being well evolved objects at a redshift z > 1. How many objects exactly populate this region is an important question which will be addressed in a future paper.
These data will be used firstly to extend the calibration of the photometric redshift code necessary for the selection of the objects for deeper spectroscopic observations at 8-m-class telescopes. For this purpose 2 nights at the VLT have been granted, and first spectra were obtained at the HET. Secondly, as a magnitude-limited sample in its own right, thus enabling us to study the evolution of the field population within the framework of a statistically well-defined galaxy sample. This will be done by means of comparisons with population synthesis models to address the evolution of the Hubble sequence and the star formation histories of galaxies as well as by means of clustering analysis using the two-point correlation function and its evolution. And thirdly for the spectroscopic identification of candidate field ellipticals out to redshifts of about 0.8 to directly address the number density of massive spheroidals in the field.
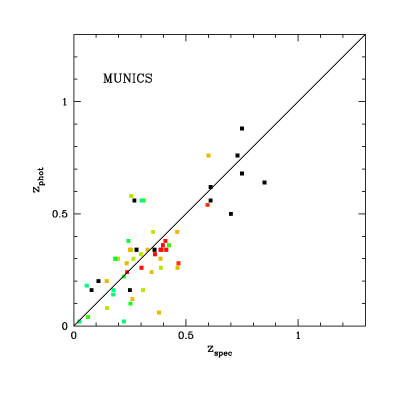
At Calar Alto, observations of objects having K < 16.5 have been carried out in May and November 2000, objects being one magnitude fainter are currently observed. First results from these spectroscopic observations are presented in Figure 3, where a comparison of photometric and spectroscopic redshifts is shown.
|
 |
 |
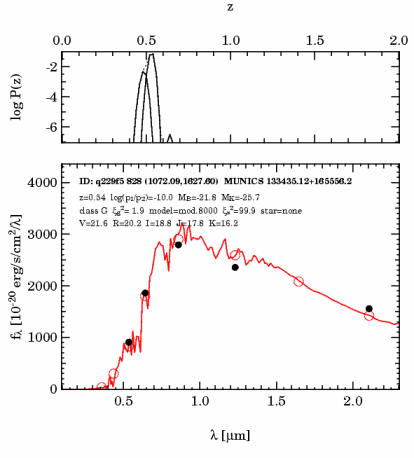
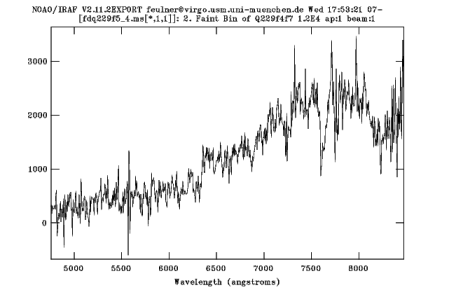
To demonstrate the efficiency of MOSCA at the 3.5-m telescope, figure 5 shows the spectrum of an early-type galaxy at redshift z = 0.59. For this object, the redshift estimated from photometry in five filters was z = 0.54, as shown in the left panel of Figure 4. The exposure time for the spectrum of this galaxy with an R-band magnitude of R = 20.2 was 200 minutes (slit-width 1.5 arcsec, grism Green 500), yielding a signal-to-noise ration in the continuum of roughly 10 at 7000 Angstroms.
|