 |
 |
|
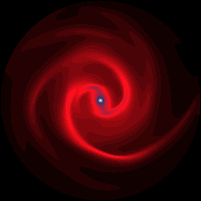
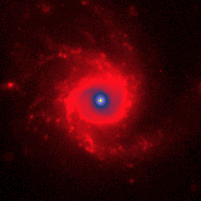
| Figure 2.
This is a comparison between the hydrodynamical gas distributions and the observed stellar distribution. We find a strong dependence of the simulated morphology to the pattern speed of the spiral. The gas distribution shown above is the result of a simulation with a pattern speed very close to the best fitting value. The match is quite good. |
||