Flat fields frames for all filters will allow to correct the multiplicative effects of the pixel-to-pixel sensitivity variation of the detector. We can create flats by taking images of the dome illuminated by a lamp, of a screen in the dome illuminated by a lamp or/and sky flats fields from the twilight sky.
Find below a statistics and comparison of flat field frames taken at the screen and at the dome.
a) Dome Flat Field (after normalisation)
| date | quadrant | int. time (seconds) | filter | mean (counts) | median (counts) | stddev (counts) | deviation (%) |
|---|---|---|---|---|---|---|---|
| 11th Feb. 2001 | down-left | 1.677 | J | 0.989 | 0.990 | 0.05718 | 5.7 |
| down-right | 1.033 | 1.034 | 0.05754 | 5.8 | |||
| up-left | 0.975 | 0.974 | 0.0556 | 5.6 | |||
| up-right | 0.970 | 0.969 | 0.05952 | 6.0 | |||
| full | 0.995 | 0.994 | 0.06258 | 6.3 | |||
| down-left | 1.677 | Km | 0.997 | 0.999 | 0.05294 | 5.3 | |
| down-right | 1.013 | 1.014 | 0.05154 | 5.2 | |||
| up-left | 0.975 | 0.977 | 0.05222 | 5.2 | |||
| up-right | 0.967 | 0.968 | 0.05544 | 5.5 | |||
| full | 0.991 | 0.993 | 0.05673 | 5.7 | |||
| 12th Feb. 2001 | down-left | 2 | J | 0.999 | 1.000 | 0.05519 | 5.5 |
| down-right | 1.026 | 1.027 | 0.05872 | 5.9 | |||
| up-left | 0.980 | 0.981 | 0.05592 | 5.6 | |||
| up-right | 0.960 | 0.961 | 0.05792 | 5.8 | |||
| full | 0.992 | 0.993 | 0.06148 | 6.1 | |||
| down-left | 1.677 | Km | 1.010 | 1.012 | 0.05245 | 5.2 | |
| down-right | 1.009 | 1.011 | 0.05232 | 5.2 | |||
| up-left | 0.982 | 0.983 | 0.05211 | 5.2 | |||
| up-right | 0.961 | 0.960 | 0.05417 | 5.4 | |||
| full | 0.992 | 0.993 | 0.0567 | 5.7 | |||
| 13th Feb. 2001 | down-left | 3 | J | 0.995 | 0.996 | 0.05989 | 6.0 |
| down-right | 1.025 | 1.024 | 0.05850 | 5.9 | |||
| up-left | 0.978 | 0.978 | 0.05578 | 5.6 | |||
| up-right | 0.960 | 0.961 | 0.05764 | 5.8 | |||
| full | 0.990 | 0.989 | 0.06105 | 6.1 | |||
| down-left | 1.677 | Km | 1.009 | 1.010 | 0.05174 | 5.2 | |
| down-right | 1.012 | 1.012 | 0.05172 | 5.2 | |||
| up-left | 0.980 | 0.980 | 0.05134 | 5.1 | |||
| up-right | 0.960 | 0.961 | 0.05353 | 5.4 | |||
| full | 0.992 | 0.994 | 0.05619 | 5.6 |
The deviation is around 5.5%, which shows that the variation of sensitivity pixel to pixel of the detector is very small.
b) Screen Flat Field (after normalisation)
| date | quadrant | int. time (seconds) | filter | mean (counts) | median (counts) | stddev (counts) | deviation (%) |
|---|---|---|---|---|---|---|---|
| 14th Feb. 2001 | down-left | 3 | J | 1.007 | 1.007 | 0.05988 | 6.0 |
| down-right | 1.037 | 1.034 | 0.06897 | 6.9 | |||
| up-left | 0.993 | 0.993 | 0.06330 | 6.3 | |||
| up-right | 0.979 | 0.975 | 0.06535 | 6.5 | |||
| full | 1.004 | 1.000 | 0.06795 | 6.8 | |||
| down-left | 3 | H | 1.012 | 1.009 | 0.06001 | 6.0 | |
| down-right | 1.038 | 1.034 | 0.06690 | 6.7 | |||
| up-left | 0.990 | 0.989 | 0.06232 | 6.2 | |||
| up-right | 0.972 | 0.970 | 0.06500 | 6.5 | |||
| full | 1.003 | 1.000 | 0.06821 | 6.8 | |||
| down-left | 2 | Km | 1.020 | 1.016 | 0.06045 | 6.0 | |
| down-right | 1.020 | 1.016 | 0.06383 | 6.4 | |||
| up-left | 0.998 | 0.994 | 0.06145 | 6.1 | |||
| up-right | 0.976 | 0.975 | 0.06295 | 6.3 | |||
| full | 1.003 | 1.000 | 0.06480 | 6.5 |
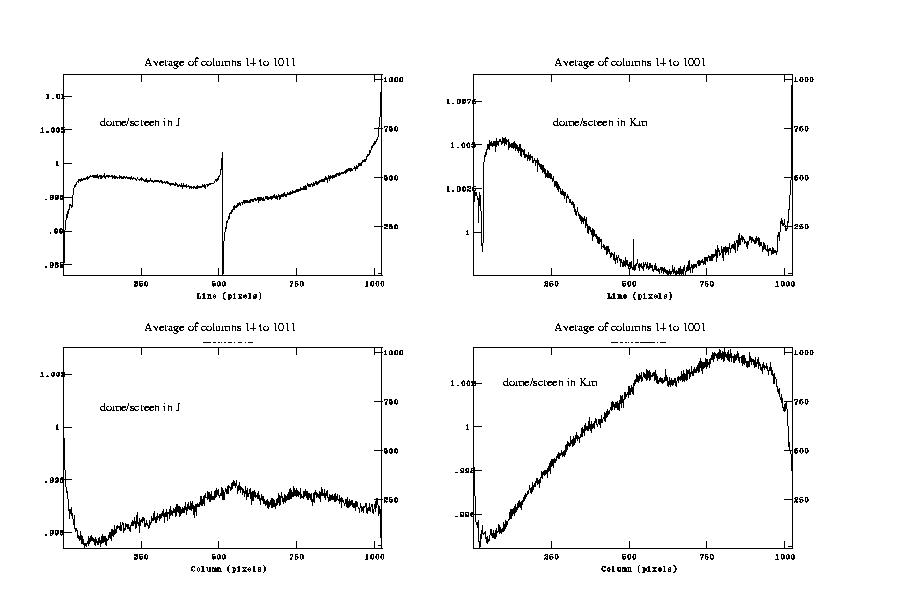
We can see that the results for dome and screen flats makes no difference, but if we divide a dome by a screen flat images with the same count level we obtain the next figure, where it is possible to see a small variation in the thermal emissivity in the Km filter. In the J filter there is a vertical gradient (up-left graph) of 0.5% and a horizontal gradient (down-left graph) of 0.2%. In the Km filter we can observe a vertical gradient (up-right graph) of 0.75% and a horizontal gradient (down-right graph) of 1%, which is nearly to the deviation of the flat (5.5%), so in this case is much better to work with the screen to avoid this small structure.