These are the values obtained for gain and readout noise:
| Up-Left Quad | Down-left Quad | Up-Right Quad | Down Right Quad | Average | |
| Gain (e per ADU) | 4.18 | 4.25 | 4.16 | 4.15 | 4.18 |
| Readout noise (e) | 21.63 | 22.95 | 22.48 | 20.92 | 21.99 |
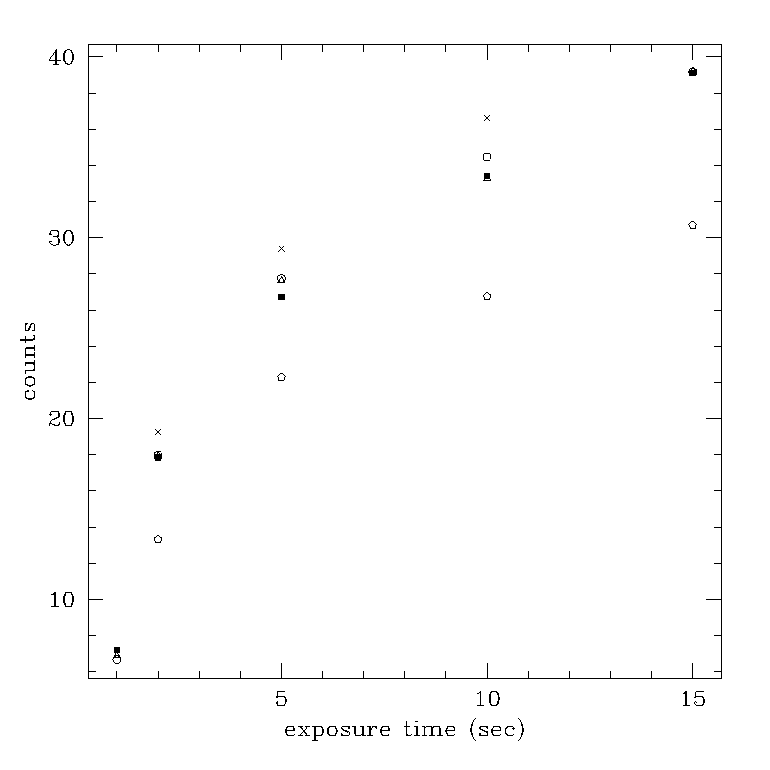
In figure 1, we plot the median for the four quadrants
and for the whole array.
These are the parameter obtained with polyfit of IRAF to calculate the parameters of the fitting for each graph (in all the cases the correlation was over 0.999). The polynomial used for the fitting is of third order:
Statistic for up-left quadrant:
|
|
|
|
|
|
|
|
|
|
|
|
|
|
|
|
|
|
|
|
|
|
|
|
|
|
|
|
|
|
Statictic for down-left quadrant:
|
|
|
|
|
|
|
|
|
|
|
|
|
|
|
|
|
|
|
|
|
|
|
|
|
|
|
|
|
|
Statistic for up-right quadrant:
|
|
|
|
|
|
|
|
|
|
|
|
|
|
|
|
|
|
|
|
|
|
|
|
|
|
|
|
|
|
Statictic for down-right quadrant:
|
|
|
|
|
|
|
|
|
|
|
|
|
|
|
|
|
|
|
|
|
|
|
|
|
|
|
|
|
|
Statictic for whole frame:
|
|
|
|
|
|
|
|
|
|
|
|
|
|
|
|
|
|
|
|
|
|
|
|
|
|
|
|
|
|
In the next table are shown the coefficients of a third order polynomial fit to the dark median data for each quadrant and the full array (in all the cases the correlation was over 0.999).
|
|
|
|
|
|
|
|
|
|
|
|
|
|
|
|
|
|
|
|
|
|
|
|
From the plots of the mean versus time, it's clear to see, that there
is something striking in the down-right quadrant. The mean is much different
to the other quadrants. A more detail study must be done to understand
what it's happening.